sparkDash v2.0 Released: Redesigned Local LLM Fleet Dashboard with In-Card Launches, Benchmarks, and Expanded Monitoring
Local LLM fleet dashboard sparkDash v2.0 is out with a redesigned UI, direct model launches from cards, Decode/Prefill/Quality/Tool Eval benchmark pages, and ne
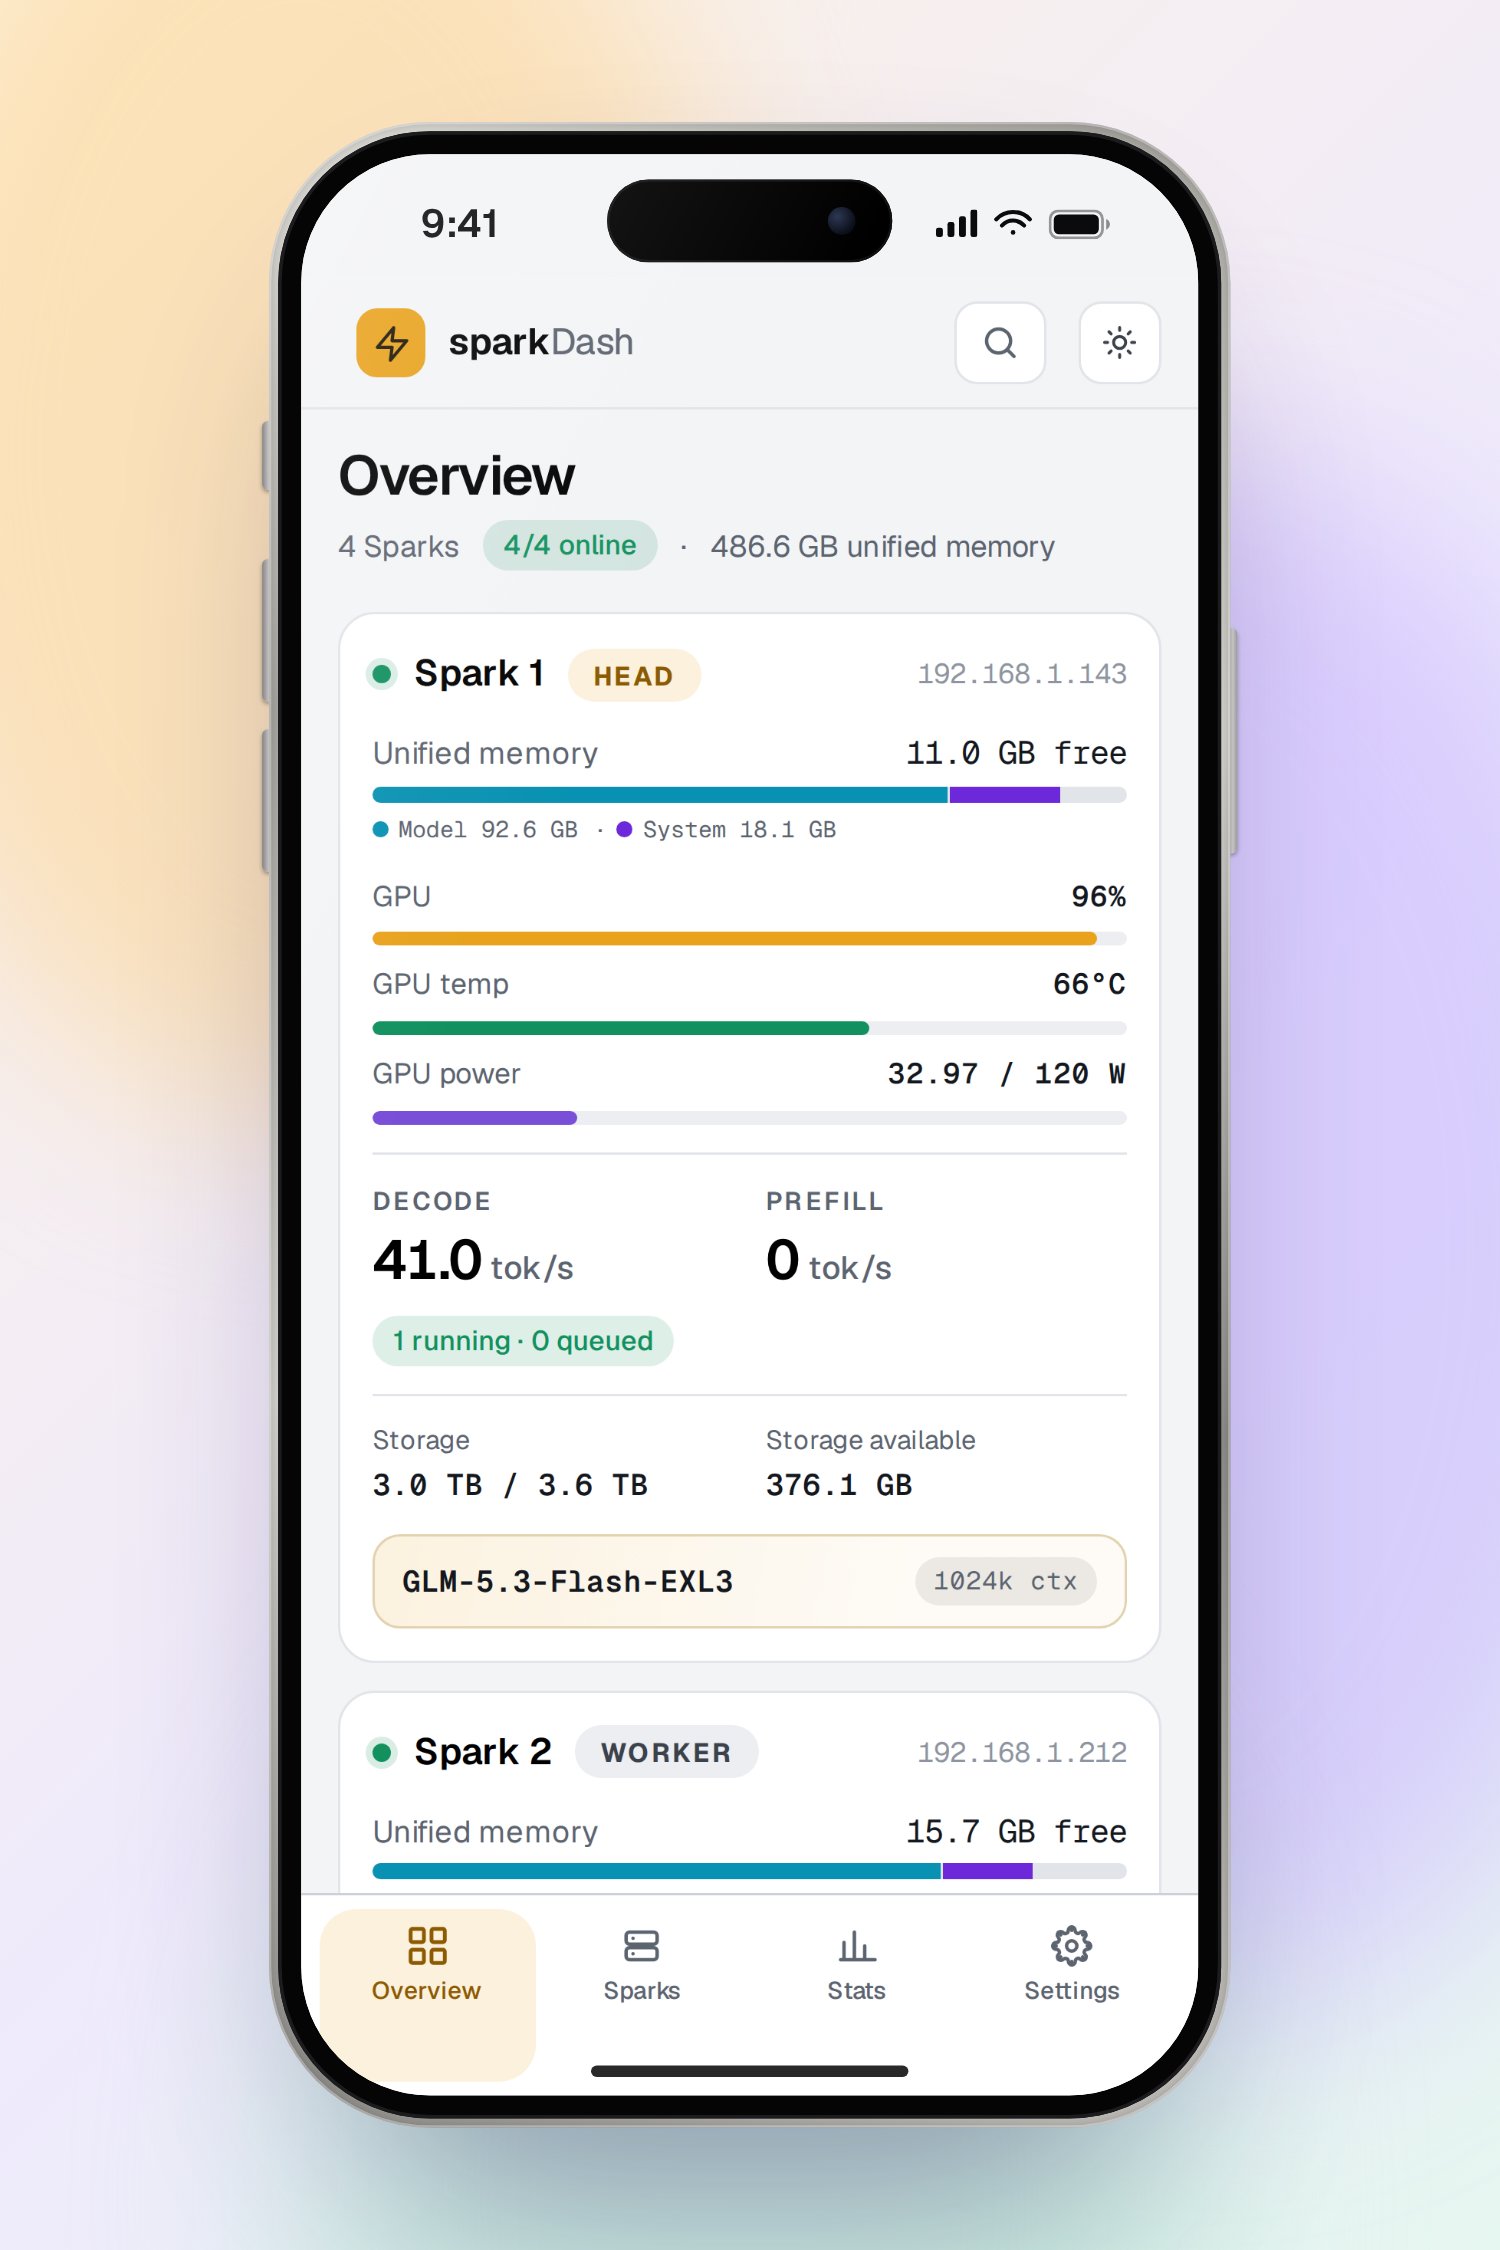
Mia (@MiaAI_lab) released sparkDash v2.0, a local LLM fleet dashboard, on October 10, 2026. The author describes it as a complete revamp, announcing live per-card fleet metrics, direct model launches from cards, dedicated benchmark pages, and new token, energy, and activity monitoring in the launch post.
Image source: Mia (@MiaAI_lab) X announcement screenshots
This story is verified against the author's first-party X announcement only; benchmark accuracy and performance figures are the author's claims with no independent measurement. The shortened download link at the end of the announcement was not expanded, so the distribution URL remains unconfirmed.
Redesigned UI and Direct Model Launches from Cards
According to the author, v2.0 brings a completely redesigned UI aimed at a modern, clean, minimal, yet powerful feel. Every card in the fleet overview shows VRAM, GPU, temperatures, power, and tok/s in real time.
Each Spark card can register start/stop scripts, so local models can be launched directly from the dashboard with loading status visible on the card. When asked about a worker Spark stuck on a loading prompt, the author advised checking the LLM port configuration (8888 by default).
Dedicated Decode, Prefill, Quality, and Tool Eval Benchmark Pages
Benchmarks are split into dedicated pages for Decode, Prefill, Quality, and Tool Eval Bench. Built-in quality benchmarks cover GSM8K, MMLU, and instruction following, with side-by-side comparison of two runs and shareable result cards, according to the author. Tool Eval Bench ships with ready-made runs.
These benchmark figures are announcement claims without independent verification. In the thread, one user reported a Prefill value spike with a TensorFold setup, and the author replied that these are momentary spikes reported by the GPU unit that usually return to normal within a second.
Expanded Monitoring: GPU History, VRAM Breakdown, Token Totals, Fleet Energy, and Activity
New monitoring features include GPU history that persists after restarts and a VRAM breakdown separating model occupancy, system usage, and free VRAM. The three new pages are Token Totals, Fleet Energy, and Activity.
Token Totals aggregates generated, prompt, and cache tokens across the fleet, with 24h, 7d, 30d, and all-time ranges, cache hit rate, automatic insights, a sortable table, and CSV export. Fleet Energy shows per-node kWh, average and peak power, Wh efficiency per 1,000 tokens, measurement coverage, and estimated cost based on the configured electricity rate.
Sources
- Mia (@MiaAI_lab) launch post on X: sparkDash v2.0 is now LIVE
- Mia (@MiaAI_lab) follow-up screenshots on X: More screenshots!