Your Agent Failed 20 Steps Ago: Open-Source Observability Tools for Agent Debugging
Discover open-source observability tools like OpenLIT, Opik, and AgentOps to trace multi-step AI agent runs, diagnose tool call errors, and catch broken traject
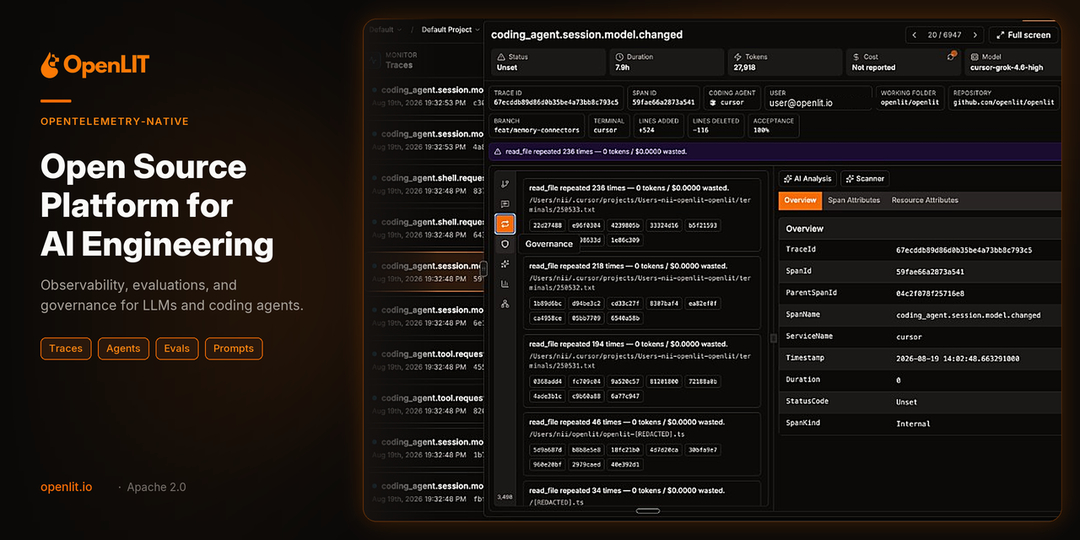
When developing and deploying autonomous multi-step AI agents, inspecting only the final output often masks critical upstream defects across the execution path. An agent may produce a plausible-looking answer while silently failing a tool invocation twenty steps earlier, recovering along a broken trajectory, or cycling through unmonitored retry loops that exhaust latency and token budgets.
Image source: https://github.com/openlit/openlit
As developer and AI researcher Zenad (@0xZenad) recently observed, "Your agent failed 20 steps ago; you just didn't notice until the final answer." As autonomous coding harnesses and multi-agent enterprise systems shoulder increasingly intricate workflows, traditional console logs and surface-level evals are proving insufficient. To build reliable systems, developers must treat execution traces—not final outputs—as the primary object of review.
The Silent Failure Problem in Autonomous Multi-Step Agents
Unlike single-turn LLM completions where inputs and outputs are neatly bounded, autonomous multi-step agents make sequential tool calls and decisions where early errors can cascade silently through the execution tree. Typical failure patterns include:
- Broken Trajectories: An external tool or API returns an unexpected error or malformed payload. Instead of handling the error cleanly, the agent hallucinates an assumption and continues along an unintended path, ultimately producing an answer that looks superficially coherent but is factually compromised.
- Silent Retry Loops: The agent repeatedly attempts similar tool invocations without making tangible progress, continuing until an arbitrary timeout or token threshold aborts the run.
- Indeterminate Root Causes: When an agent task fails, teams struggle to isolate whether the failure originated in the model's reasoning prompt, a schema mismatch in a tool call response, or an unhandled edge case inside the orchestration harness.
Catching these issues requires dedicated observability platforms capable of capturing OpenTelemetry spans, step-by-step tool inputs and outputs, latency metrics, and prompt tokens across every autonomous hop.
Curated Open-Source Repositories for Tracing Trajectories and Tool Calls
Zenad's curated list highlights key open-source repositories designed to surface hidden execution dynamics and bring rigor to agent debugging:
-
OpenLIT (openlit/openlit) An Apache 2.0-licensed open-source observability and evaluation platform built natively on OpenTelemetry standards. OpenLIT traces entire agent runs instead of isolating the final response, consolidating LLM calls, tool executions, system prompts, latency, token metrics, and API costs into a single unified telemetry view. Its OTel foundation allows direct integration into existing enterprise monitoring stacks such as Prometheus, Grafana, and Elastic.
-
Opik (comet-ml/opik) Developed by Comet ML, Opik provides full trace trees for multi-step agent interactions and tool invocations. A standout capability is its evaluation pipeline: production runs that exhibit broken behavior can be instantly converted into golden evaluation datasets, enabling developers to run automated evals and verify whether an updated prompt or bug fix truly resolved the issue.
-
Laminar (lmnr-ai/lmnr) An agent tracing engine that enables developers to define monitored behaviors using plain English rules. Assertions such as "agent is stuck in a loop" or unexpected tool parameter deviations become real-time telemetry alerts, letting engineering teams intercept anomalies before users encounter broken workflows.
-
LangWatch (langwatch/langwatch) Designed for end-to-end scenario evaluations rather than isolated prompt tests. LangWatch simulates realistic user sessions against the entire agent pipeline, scores outputs across steps, and pinpoints the exact branching decision that caused an execution trajectory to break.
-
AgentOps (AgentOps-AI/AgentOps) Provides session replay capabilities specifically tailored for autonomous agents. Teams can step through execution chronologically, inspect tool parameters and responses, track dollar costs per step, and diagnose where multi-agent communication broke down.
-
TraceRoot Automates trace analysis by deploying anomaly detectors that flag suspicious patterns across thousands of agent runs. It links detected tool errors and execution anomalies directly back to source code locations and GitHub commit history for rapid triage.
-
Agent Health Diagnoses trajectory drift by benchmarking the path an agent actually took against the expected execution graph. This is particularly valuable when an agent generates a seemingly correct final answer despite taking an unstable, high-risk detour through unexpected tools.
-
PandaProbe A self-hostable inspection probe suited for on-premise infrastructure, privacy-sensitive enterprise environments, and local debugging workflows where sending trace data to external third-party endpoints is restricted.
Production Considerations and Recommended Debugging Workflows
Integrating agent observability into active development workflows requires addressing several architectural tradeoffs:
- Framework SDK Compatibility: Different agent frameworks—such as LangGraph, CrewAI, LlamaIndex, or native agent SDKs—feature varying degrees of automatic telemetry instrumentation. Teams should audit whether their chosen framework supports drop-in OpenTelemetry middleware or requires explicit function decorators around tool calls.
- Telemetry Ingestion Cost and Latency: Recording full prompts, completions, and heavy tool payloads across high-volume production traffic can rapidly accumulate storage expenses and introduce minor latency overhead. Implementing intelligent sampling policies—such as 100% trace capture on errors or high latency while downsampling nominal runs—helps preserve telemetry budgets.
- Closing the Evaluation Feedback Loop: Observability provides little value if error data remains passive. Teams should adopt the discipline of converting detected production failures into regression datasets, ensuring that each patched edge case is continuously validated against future model and harness updates.